A specialist supplier with several routes into search
Based in Los Angeles and operating since 1976, the company sells commercial and industrial washers and dryers, helps develop laundromats, and supports customers with equipment service, parts, leasing and financing. A hotel manager replacing machines has a different need from a laundromat owner comparing brands or a facility manager looking for repair. The site needs to answer each of those questions clearly to make search visibility useful.
The supplied reporting files show what happened in search and on the site. They do not include an engagement start date or a task-level delivery record, so this case study does not attribute the measured change to a particular page, technical fix or campaign.
What changed across equal reporting windows
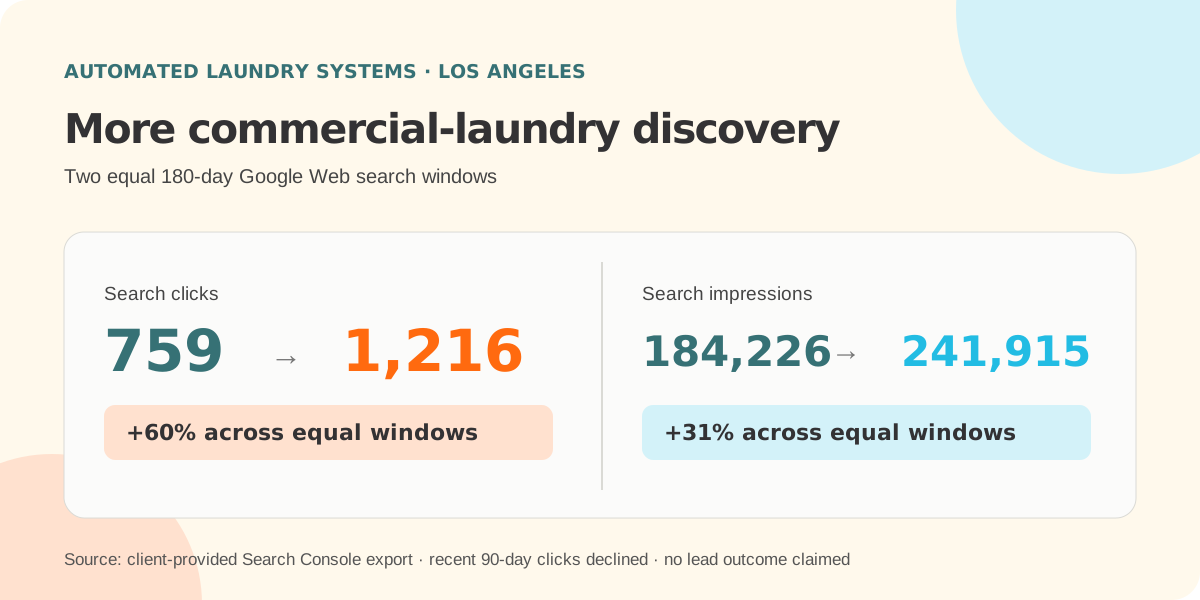
From June 20 to December 16, 2025, Google Search Console recorded 759 Web search clicks and 184,226 impressions. From April 23 to October 19, 2026, the latest 180-day window recorded 1,216 clicks and 241,915 impressions. That is 457 additional clicks, up 60%, and 57,689 additional impressions, up 31%, across two equal windows separated in time. The full 487-day export contains 2,760 clicks and 571,577 impressions.
The near-term view is less positive. The latest 90 days, July 22 to October 19, delivered 521 clicks and 112,585 impressions, compared with 695 clicks and 129,330 impressions in the preceding 90 days. A longer-window gain should not be read as a claim that every month grew or that momentum is currently accelerating.
Where people found the business
The Search Console page export attributes 1,270 clicks to the homepage over the full reporting window. The American Dryer Corporation equipment page received 168, the service page 142, and the Fagor and UniMac repair guides 128 and 104. An on-site laundry explainer received 82 clicks. This spread shows discovery through the brand, equipment, service and research journeys rather than a single article carrying the result.
The top query in the export is the company's own name, with 382 clicks. Other queries include equipment brands and repair needs, while 'commercial laundry equipment' generated many impressions but only five recorded clicks. Brand demand, product research and commercial intent should be evaluated separately. The supplied position tracker covers selected keywords only; its four #1 terms in the September 21 to October 21 snapshot do not describe rankings for all searches.
What analytics can and cannot prove
The supplied GA4 overview reports 3,622 Organic Search sessions and 270 conversion events across all channels from January 1 to October 21, 2026. Search Console clicks and GA4 sessions use different definitions and date windows, so their totals should not match exactly. The overview does not identify conversion events as qualified quotes, equipment sales or service jobs. Its daily channel CSV stops at 1,000 rows, so summing that file cannot establish complete channel-level conversion totals. Paid activity is also present and should not be credited to organic search.
The strongest next measurement step is to classify quote requests, service calls and equipment enquiries by source and landing page, then link them to accepted opportunities. That would distinguish useful commercial demand from general research and show whether the broader search footprint is contributing to sales.
Sources and measurement
Google Web search totals, page and query examples come from client-provided Search Console exports supplied October 21, 2026. The 180-day comparisons use June 20 to December 16, 2025 and April 23 to October 19, 2026; the 90-day comparisons use April 23 to July 21 and July 22 to October 19, 2026. Organic sessions and all-channel conversion events come from the supplied GA4 overview for January 1 to October 21, 2026; the accompanying daily channel CSV is capped at 1,000 rows. Selected rankings come from the supplied September 21 to October 21 position overview. Company services and history were checked against its public website. No qualified-enquiry, sales, revenue or task-level delivery record was supplied.